|

|
|
Insider TA's BA Mask settingThe BA Optimizer is a great tool for obtaining the best BA yield. If you recall, the BA method is based on three parameters: Moving Average, BA Average, and BA Tag, all of which are adjusted via the following switches...
The BA Optimizer samples numerous combinations of the above switch settings. With each combination, it analyzes the stock data and determines where the buy and sell tags are generated. The switch settings that produces the highest yield are then selected. We refer to the range of stock data processed by the BA Optimizer as the optimized range. Keep in mind that the BA optimizer bases its buy and sell signals on the data that it has already seen. Before putting trust in these signals, you will certainly want to test their accuracy. Specifically, we want to see how accurate buy and sell tags are outside of the optimized range. If you optimized the entire database, you must then wait "x" number of days for future BA buy or sell signals to be generated. Only then can you conclude how accurately the BA system works for the given stock. Many people prefer not to wait "x" amount of days to add additional data. To satisfy this demand, the BA Optimizer can be told to exclude a specified number of trailing entries. This introduces the concept of a BA Mask. In effect, we are "masking" out some of the data that the BA Optimizer is allowed to see.
There are two ways of identifying a BA Mask:
We highly recommend you make use of the BA Mask feature. It allows you to compare the BA yields within the optimized range against the trailing non-optimized period, without having to wait so many days for new entries to be added. Ideally, you would like to see the BA % yield for the entire graph be greater than the BA % yield resulting from the optimized period. This shows that the BA Optimizer has been configured successfully, because future signals (based on data not seen by the optimizer) are also accurate. The File Scan Utility's BA % Yield Types reveal these statistics. Configuring the BA Mask:The BA Mask is configured in the Yields | Box Analyzer Masker section in the Configuration Options Panel: 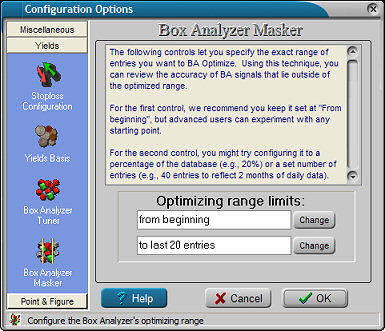
After BA Optimizing has been performed, INSIDER TA will reveal the following in its box chart:
All boxes within the optimized range of boxes will be in a lighter yellow color. But any future days will be in a darker yellow. This provides an easy means of visualizing the extent of the optimized data, and how accurately BA buy/sell tags are placed beyond the optimized range. You will also see a vertical dashed line (in yellow), labeled as shown above: ...to last 24 entries (2004-11-24): 8,8,6. |
|
P.O. Box 416, North Stonington CT 06359 USA Copyright ©1995-2024 Stock Blocks, Inc.® Stock Blocks is a registered trademark of Stock Blocks, Inc. |
|
|